Install Tools
- Check marked (✓ ) download links here
Firefox is a popular web browser. We will use its built-in developer tools to run and debug programs within the browser. Visual Studio Code is a widely-used professional source code editor.Install a font designed for editing source code. It's both fun and practical. I recommend two here. You can preview Hack without installing but need to have Input Mono on your device to see it. If not installed, you will get the browser's default mono-space font instead, most likely Courier or Consolas.
Run from Your Machine
- Create a 223 folder in your desktop (you can keep your code anywhere you want)
c:\223 or d:\cs223 are good options; short folder paths are easier to type in a command window
- Download to your folder both jscaller.html and sieve.js
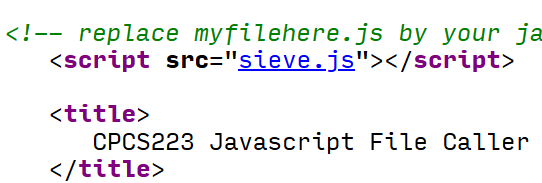
- Drag-drop jscaller.html to browser window (after you change it to call sieve.js, of course)
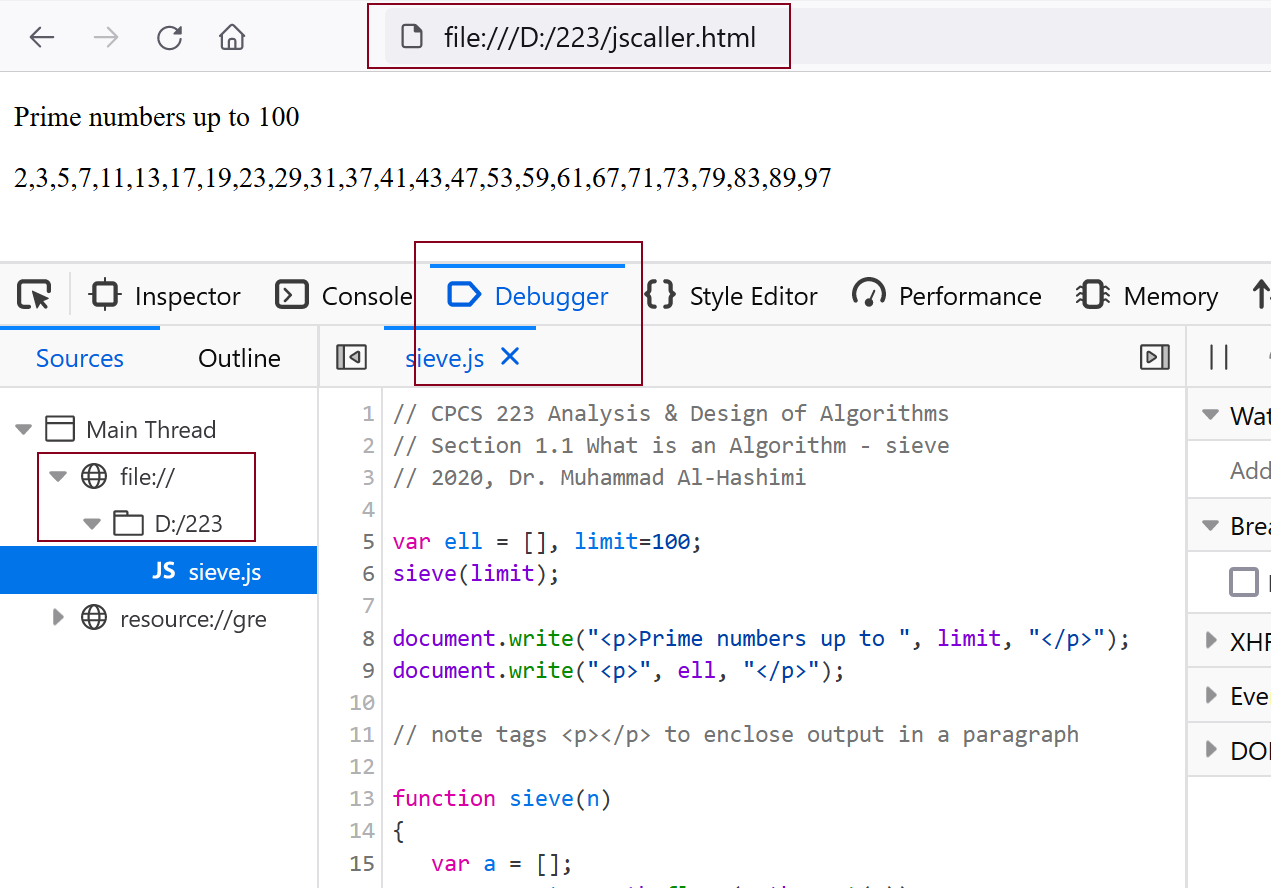
- Locate your sources, if necessary press F12 and reload page from Debugger panel
More click here
Edit Programs
- Run VS Code (VSC)
 launch quickly via +R, type: code Enter
 -
Use the menu to open your code folder and to load programs
 Keyboard shortcuts are faster:
- to open a file Ctrl+O (letter-O)
- to open folder Ctrl+K Ctrl+O
There is a complete list under the menu
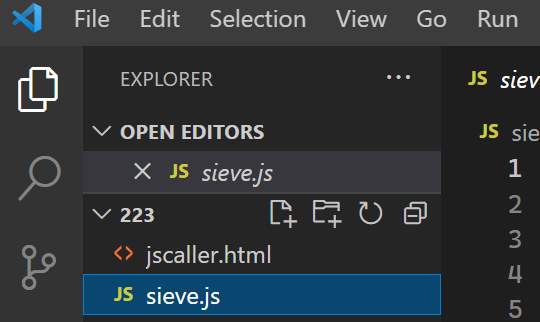
in VSC explorer (top left-side tool menu), single-click file to quickly view or double-click to open for editingMore click here
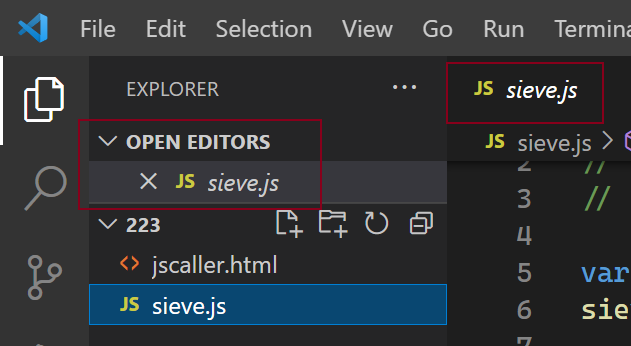
The preview window has a slanted (italic font) title. Quickly go through files and check their contents in the same place without actually opening.
Start typing to auto open the file (note window title change).
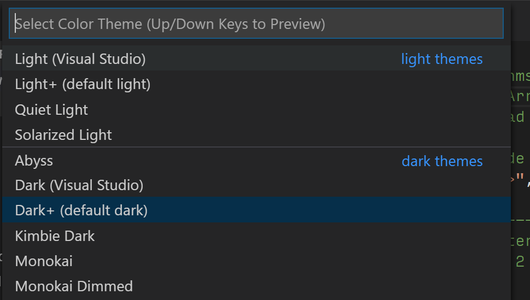
- Check themes, change editor font
quickly access VSC commands from the command palette, press Ctrl+Shift+P and type ‘preferences: color theme’ to bring up the themes menu, try different ones (works best with a program open)change font family and size from menu item (> menu), or type ‘settings’ or ‘open settings’ in the command palette and choose ‘Preferences: Open User Settings’or press Ctrl+, to quickly open user preferences
More click here
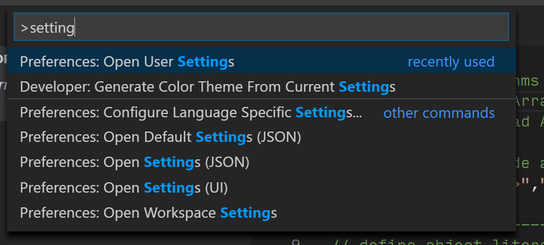
The command palette is faster than hunting for commands in menus, it will remember recent commands to make finding frequent ones even faster
- Try different coding styles, auto indent, auto complete
VSC will sense your code indentation style and apply it automatically, try a block statement (
iforfor) with both on-same and on-own line left-brace { placement and see what happenssome people find autocomplete (IntelliSence in VSC terms) useful others find it annoying, check this video, try it and seeMore click here
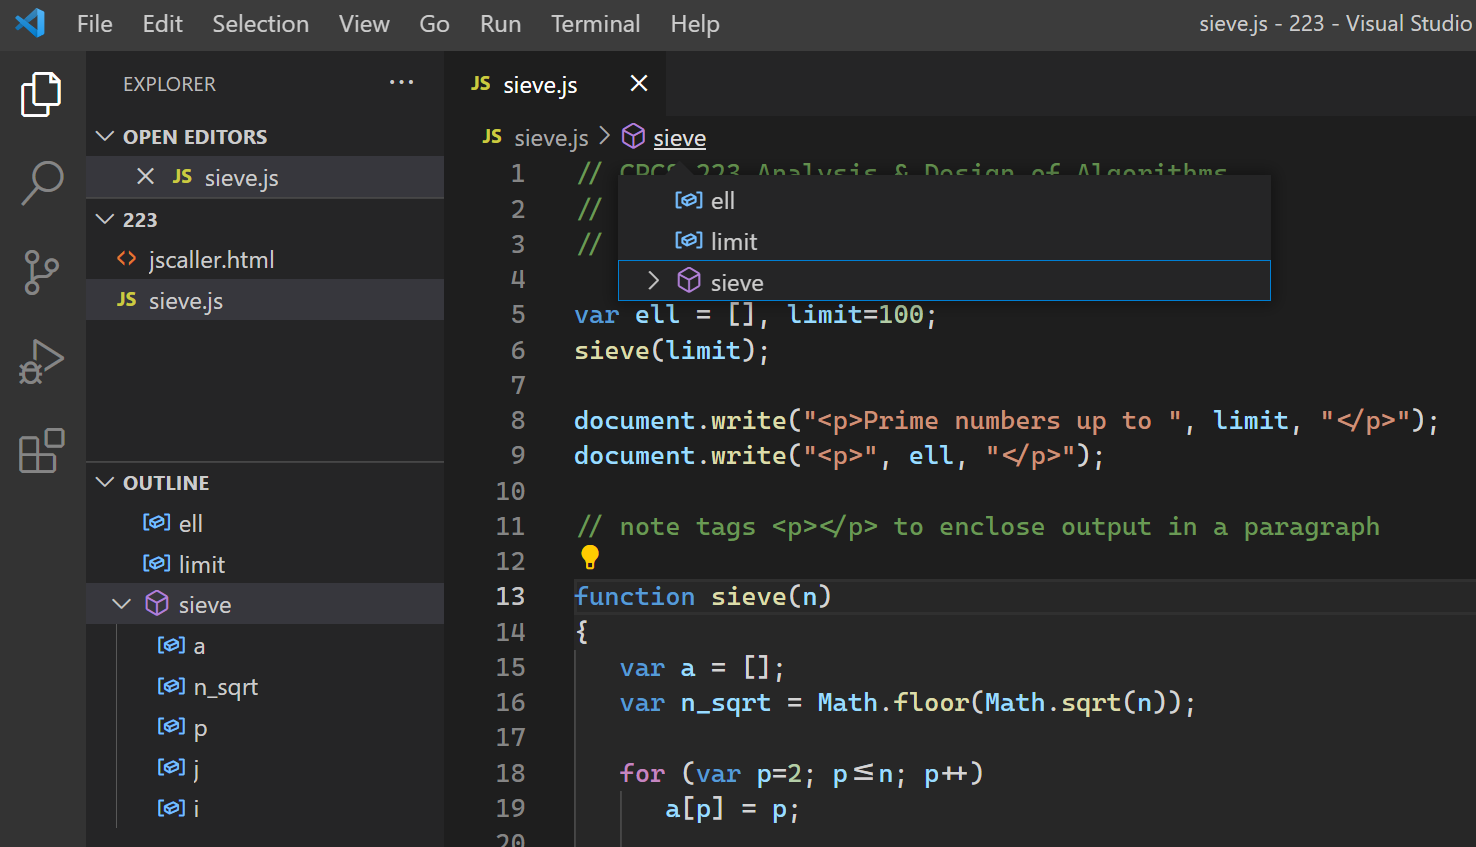
(Screenshot) Navigate code via source outlines. Browse program components including global variables and jump quickly there. To show/hide outline, right-click near EXPLORER heading label.
Look for program editing shortcuts as you go. Try these 2 to for a start:
- Alt+Up/Down to move a line up/down (no cut-paste mess)
- Ctrl+/ to quickly comment/uncomment a line (no typing/deleting mess)
Debug Code
Don't run code blind, set breakpoints and watch vars to see what's going on
-
Run practice program, F12 and switch to Debugger
panel (may need to re-load to open the source)
navigate to sieve.js in the source list (left pane in Debugger)
 Click a code line to insert a breakpoint, press F5 to start debugging
set a breakpoint at line 15 then F5, program will run and stop at marked linedisable or delete the breakpoint from the Breakpoints section of the Debugger tools pane, or simply click again on the code line to delete the breakpoint
Click a code line to insert a breakpoint, press F5 to start debugging
set a breakpoint at line 15 then F5, program will run and stop at marked linedisable or delete the breakpoint from the Breakpoints section of the Debugger tools pane, or simply click again on the code line to delete the breakpoint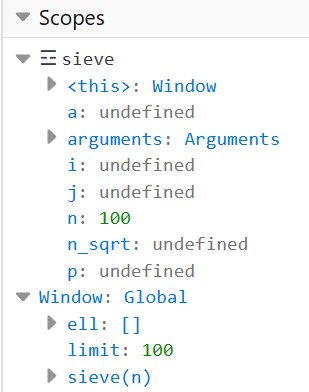 Check variables under Scopes (Debugger tools pane)
double-click a var in the Debugger panel to select then right-click and choose menu item to track separtely under Watch expressions sectionor simply type the var name in the ‘Watch expressions’ section
Check variables under Scopes (Debugger tools pane)
double-click a var in the Debugger panel to select then right-click and choose menu item to track separtely under Watch expressions sectionor simply type the var name in the ‘Watch expressions’ section- Use the Console to debug
Output debug info via
console.log(), add line to practice program and rerun:
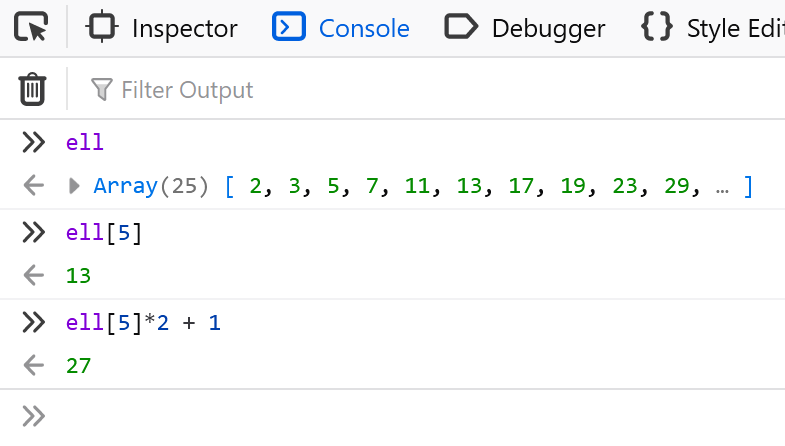
switch to Console, you should see a pretty print of the arrayconsole.log (JSON.stringify( ell, null, " " ));or interactively check vars and evaluate expressions, switch to the Console while debugging or after a run and type a var nameMore click here
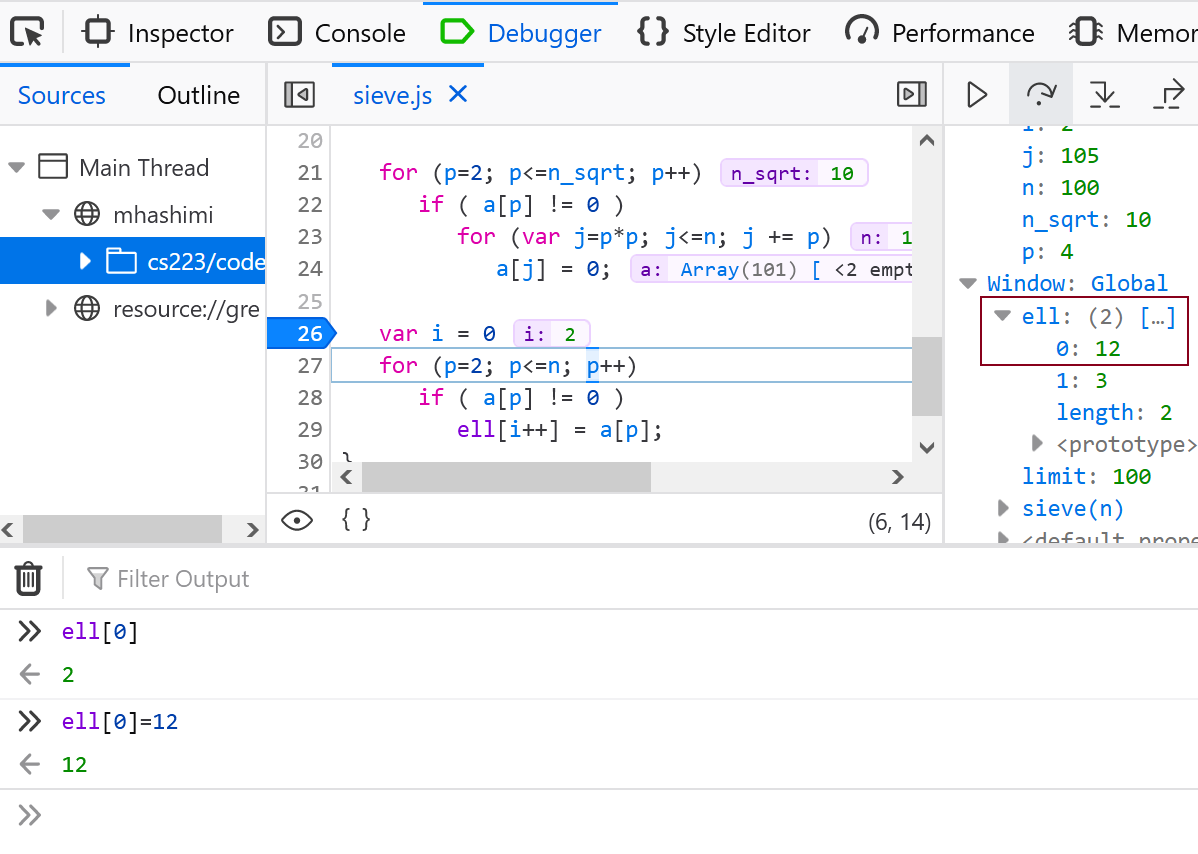
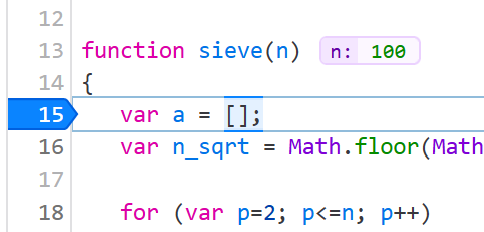
(Screenshot 2) You can change a variable while debugging to force a condition or end a long for-loop. In the example,
ell[0], which should normally store 2, was replaced by 12 from the console while stepping.Try it. Type
ellto check after the program finishes (you should also see its value change in the Debugger tools once you go back to stepping)BTW, pres Esc to show/hide split console panel or use arrow keys to recall a previously entered command (save on retyping)
What next? Start on the programming exercises ...